
Page 142 - IJET_July2021_final
P. 142
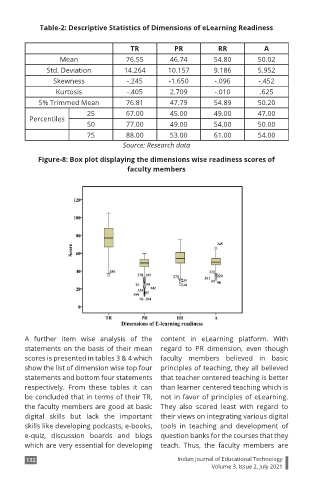
Table-2: Descriptive Statistics of Dimensions of eLearning Readiness


                                       TR           PR          RR            A
                  Mean                76.55       46.74        54.80        50.02
               Std. Deviation        14.264       10.157       9.186        5.952
                Skewness              -.245       -1.650       -.096        -.452
                 Kurtosis             -.405       2.709        -.010        .625
            5% Trimmed Mean           76.81       47.79        54.89        50.20
                          25          67.00       45.00        49.00        47.00
          Percentiles
                          50          77.00       49.00        54.00        50.00
                          75          88.00       53.00        61.00        54.00
                                     Source: Research data

            Figure-8: Box plot displaying the dimensions wise readiness scores of
                                      faculty members


        A  further item wise  analysis  of  the  content  in  eLearning  platform. With
        statements on the basis of their mean  regard to PR dimension,  even though
        scores is presented in tables 3 & 4 which  faculty members believed in basic
        show the list of dimension wise top four  principles of teaching, they all believed
        statements and bottom four statements  that teacher centered teaching is better
        respectively. From  these tables it can  than learner centered teaching which is
        be concluded that in terms of their TR,  not in favor of principles of eLearning.
        the faculty members are good at basic  They  also  scored  least with  regard to
        digital  skills but  lack the important  their views on integrating various digital
        skills like developing podcasts, e-books,  tools in teaching and development of
        e-quiz,  discussion  boards  and  blogs  question banks for the courses that they
        which are very essential for developing  teach. Thus, the faculty members are
         132                                        Indian Journal of Educational Technology
                                                              Volume 3, Issue 2, July 2021