
Page 141 - IJET_July2021_final
P. 141
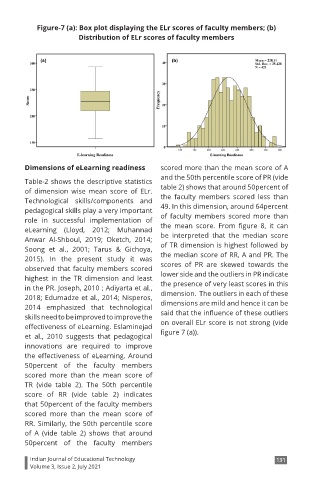
Figure-7 (a): Box plot displaying the ELr scores of faculty members; (b)
                        Distribution of ELr scores of faculty members


        Dimensions of eLearning readiness       scored more than the mean score of A
                                                and the 50th percentile score of PR (vide
        Table-2 shows the descriptive statistics
        of  dimension  wise  mean score of  ELr.   table 2) shows that around 50percent of
        Technological  skills/components  and   the faculty members  scored less than
        pedagogical skills play a very important   49. In this dimension, around 64percent
        role in  successful  implementation  of   of faculty members scored more than
        eLearning  (Lloyd,  2012;  Muhannad     the  mean  score.  From  figure  8,  it  can
        Anwar  Al-Shboul,  2019;  Oketch,  2014;   be  interpreted that the  median score
        Soong  et  al.,  2001;  Tarus  &  Gichoya,   of TR dimension is highest followed by
        2015).  In  the present study it was    the median score of RR, A and PR. The
        observed that faculty members scored    scores of  PR  are skewed  towards  the
        highest  in  the TR dimension  and  least   lower side and the outliers in PR indicate
        in the PR. Joseph, 2010 ; Adiyarta et al.,   the presence of very least scores in this
        2018; Edumadze et al., 2014; Nisperos,   dimension.  The outliers in each of these
        2014  emphasized  that  technological   dimensions are mild and hence it can be
        skills need to be improved to improve the   said that the influence of these outliers
        effectiveness of eLearning. Eslaminejad   on overall ELr score is not strong (vide
        et al., 2010  suggests that pedagogical   figure 7 (a)).
        innovations  are required to improve
        the effectiveness of eLearning. Around
        50percent  of  the  faculty  members
        scored more than  the  mean score of
        TR  (vide table 2). The 50th percentile
        score of RR (vide table 2) indicates
        that 50percent of the faculty members
        scored more than  the  mean score of
        RR. Similarly, the 50th percentile score
        of A (vide  table 2)  shows  that around
        50percent  of  the  faculty  members

          Indian Journal of Educational Technology                               131
          Volume 3, Issue 2, July 2021