
Page 138 - IJET_July2021_final
P. 138
members and all the faculty members their pedagogical practices and attitude
are technologically ready for eLearning. towards eLearning is very low.
However, their readiness in terms of
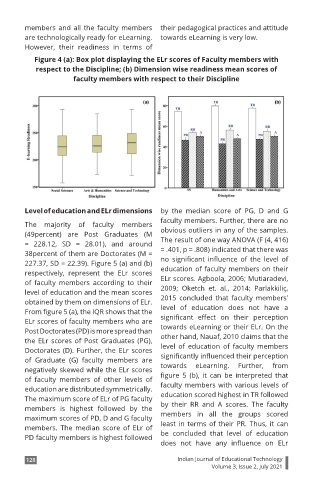
Figure 4 (a): Box plot displaying the ELr scores of Faculty members with
respect to the Discipline; (b) Dimension wise readiness mean scores of
faculty members with respect to their Discipline
Level of education and ELr dimensions by the median score of PG, D and G
faculty members. Further, there are no
The majority of faculty members
(49percent) are Post Graduates (M obvious outliers in any of the samples.
= 228.12, SD = 28.01), and around The result of one way ANOVA (F (4, 416)
38percent of them are Doctorates (M = = .401, p = .808) indicated that there was
227.37, SD = 22.39). Figure 5 (a) and (b) no significant influence of the level of
respectively, represent the ELr scores education of faculty members on their
of faculty members according to their ELr scores. Agboola, 2006; Mutiaradevi,
level of education and the mean scores 2009; Oketch et. al., 2014; Parlakkiliç,
obtained by them on dimensions of ELr. 2015 concluded that faculty members'
From figure 5 (a), the IQR shows that the level of education does not have a
ELr scores of faculty members who are significant effect on their perception
Post Doctorates (PD) is more spread than towards eLearning or their ELr. On the
the ELr scores of Post Graduates (PG), other hand, Nauaf, 2010 claims that the
Doctorates (D). Further, the ELr scores level of education of faculty members
of Graduate (G) faculty members are significantly influenced their perception
negatively skewed while the ELr scores towards eLearning. Further, from
of faculty members of other levels of figure 5 (b), it can be interpreted that
education are distributed symmetrically. faculty members with various levels of
The maximum score of ELr of PG faculty education scored highest in TR followed
members is highest followed by the by their RR and A scores. The faculty
maximum scores of PD, D and G faculty members in all the groups scored
members. The median score of ELr of least in terms of their PR. Thus, it can
PD faculty members is highest followed be concluded that level of education
does not have any influence on ELr
128 Indian Journal of Educational Technology
Volume 3, Issue 2, July 2021