
Page 134 - IJET_July2021_final
P. 134
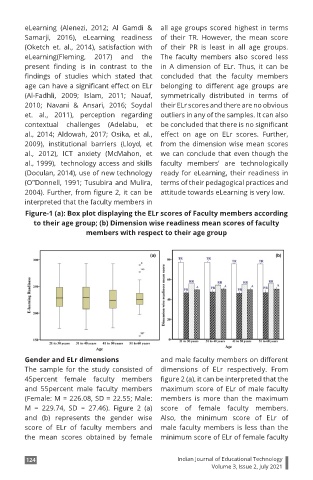
eLearning  (Alenezi,  2012;  Al  Gamdi  &  all age groups scored highest in terms
        Samarji, 2016), eLearning readiness  of their TR.  However, the mean score
        (Oketch  et.  al., 2014),  satisfaction  with  of their PR is least in all age groups.
        eLearning(Fleming,  2017)  and  the  The  faculty  members also  scored  less
        present  finding  is  in  contrast  to  the  in  A  dimension of ELr. Thus, it can be
        findings  of  studies  which  stated  that  concluded  that the faculty members
        age can have a significant effect on ELr  belonging  to  different  age  groups  are
        (Al-Fadhli,  2009;  Islam,  2011;  Nauaf,  symmetrically distributed  in  terms of
        2010;  Navani  &  Ansari,  2016;  Soydal  their ELr scores and there are no obvious
        et. al., 2011),  perception regarding  outliers in any of the samples. It can also
        contextual challenges  (Adelabu,  et  be concluded that there is no significant
        al.,  2014;  Aldowah,  2017;  Osika,  et  al.,  effect  on  age  on  ELr  scores.  Further,
        2009),  institutional barriers (Lloyd,  et  from the dimension wise mean scores
        al., 2012),  ICT  anxiety  (McMahon,  et  we can conclude that even though the

        al., 1999),  technology access and skills  faculty  members’ are technologically
        (Doculan, 2014), use of new technology  ready for eLearning, their readiness in
        (O"Donnell, 1991; Tusubira and Mulira,  terms of their pedagogical practices and
        2004). Further, from figure 2, it can be  attitude towards eLearning is very low.
        interpreted that the faculty members in
        Figure-1 (a): Box plot displaying the ELr scores of Faculty members according
           to their age group; (b) Dimension wise readiness mean scores of faculty
                          members with respect to their age group


        Gender and ELr dimensions               and male faculty members on different
        The sample for the study  consisted  of  dimensions  of  ELr respectively.  From
        45percent  female faculty  members  figure 2 (a), it can be interpreted that the
        and  55percent  male faculty  members  maximum score of ELr of male faculty
        (Female: M = 226.08, SD = 22.55; Male:  members is  more than  the  maximum
        M = 229.74,  SD = 27.46).  Figure 2 (a)  score of  female faculty  members.
        and (b) represents the gender wise  Also, the  minimum score of  ELr of
        score of  ELr of  faculty  members and  male faculty members is less than the
        the  mean  scores obtained  by  female  minimum score of ELr of female faculty


         124                                        Indian Journal of Educational Technology
                                                              Volume 3, Issue 2, July 2021