
Page 133 - IJET_July2021_final
P. 133
2013; Doculan, 2014; Kaur & Abas, 2004; required box plots and bar charts were
Mercado, 2008; Oketch, 2014) helped used to present the results. Influence of
to identify the possible dimensions of demographic factors was tested using
eLearning readiness and the statements One-way ANOVA.
to be included in them. After making the
corrections as per the suggestions given Results and Discussion
by the experts who were requested to Age and ELr dimensions
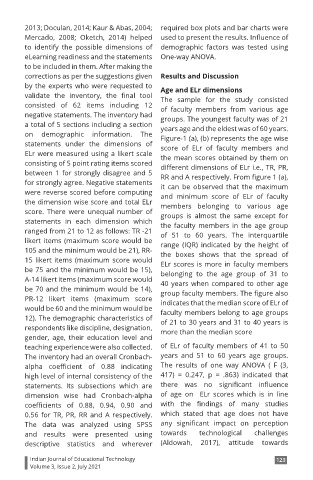
validate the inventory, the final tool The sample for the study consisted
consisted of 62 items including 12 of faculty members from various age
negative statements. The inventory had groups. The youngest faculty was of 21
a total of 5 sections including a section years age and the eldest was of 60 years.
on demographic information. The Figure-1 (a), (b) represents the age wise
statements under the dimensions of score of ELr of faculty members and
ELr were measured using a likert scale the mean scores obtained by them on
consisting of 5 point rating items scored different dimensions of ELr i.e., TR, PR,
between 1 for strongly disagree and 5 RR and A respectively. From figure 1 (a),
for strongly agree. Negative statements it can be observed that the maximum
were reverse scored before computing and minimum score of ELr of faculty
the dimension wise score and total ELr members belonging to various age
score. There were unequal number of groups is almost the same except for
statements in each dimension which the faculty members in the age group
ranged from 21 to 12 as follows: TR -21 of 51 to 60 years. The interquartile
likert items (maximum score would be range (IQR) indicated by the height of
105 and the minimum would be 21), RR- the boxes shows that the spread of
15 likert items (maximum score would ELr scores is more in faculty members
be 75 and the minimum would be 15), belonging to the age group of 31 to
A-14 likert items (maximum score would 40 years when compared to other age
be 70 and the minimum would be 14), group faculty members. The figure also
PR-12 likert items (maximum score indicates that the median score of ELr of
would be 60 and the minimum would be faculty members belong to age groups
12). The demographic characteristics of of 21 to 30 years and 31 to 40 years is
respondents like discipline, designation, more than the median score
gender, age, their education level and
teaching experience were also collected. of ELr of faculty members of 41 to 50
The inventory had an overall Cronbach- years and 51 to 60 years age groups.
alpha coefficient of 0.88 indicating The results of one way ANOVA ( F (3,
high level of internal consistency of the 417) = 0.247, p = .863) indicated that
statements. Its subsections which are there was no significant influence
dimension wise had Cronbach-alpha of age on ELr scores which is in line
coefficients of 0.88, 0.94, 0.90 and with the findings of many studies
0.56 for TR, PR, RR and A respectively. which stated that age does not have
The data was analyzed using SPSS any significant impact on perception
and results were presented using towards technological challenges
descriptive statistics and wherever (Aldowah, 2017), attitude towards
Indian Journal of Educational Technology 123
Volume 3, Issue 2, July 2021