
Page 45 - IJET_July2021_final
P. 45
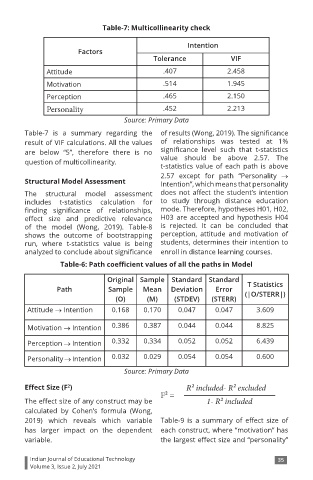
Table-7: Multicollinearity check

                                                       Intention
                        Factors
                                              Tolerance             VIF
               Attitude                         .407               2.458
               Motivation                       .514               1.945

               Perception                       .465               2.150
               Personality                      .452               2.213
                                     Source: Primary Data
        Table-7 is a summary regarding the  of results (Wong, 2019). The significance
        result of VIF calculations. All the values   of relationships was tested at 1%
        are below  “5”, therefore there is no   significance  level  such  that  t-statistics
        question of multicollinearity.          value should  be above 2.57.  The
                                                t-statistics value of each path is above
                                                2.57  except for path “Personality  →
        Structural Model Assessment             Intention”, which means that personality
        The   structural  model   assessment    does not affect  the student’s intention
        includes  t-statistics calculation for   to study  through  distance education
        finding  significance  of  relationships,   mode. Therefore, hypotheses H01, H02,
        effect  size  and  predictive  relevance   H03  are accepted  and  hypothesis  H04
        of the model (Wong,  2019).  Table-8    is rejected. It can be  concluded  that
        shows  the  outcome of  bootstrapping   perception,  attitude  and  motivation  of
        run,  where  t-statistics value  is being   students, determines their intention to
        analyzed to conclude about significance  enroll in distance learning courses.
                  Table-6: Path coefficient values of all the paths in Model

                                Original  Sample  Standard  Standard
                                                                         T Statistics
                 Path           Sample    Mean     Deviation   Error    (|O/STERR|)
                                   (O)      (M)     (STDEV)   (STERR)
         Attitude → Intention    0.168     0.170     0.047     0.047       3.609

         Motivation → Intention  0.386     0.387     0.044     0.044       8.825

         Perception → Intention  0.332     0.334     0.052     0.052       6.439

         Personality → Intention  0.032    0.029     0.054     0.054       0.600
                                     Source: Primary Data

        Effect Size (F )                               R2 included- R2 excluded
                     2
                                                F2 =
        The effect size of any construct may be              1- R2 included
        calculated by  Cohen’s  formula  (Wong,
        2019)  which  reveals which  variable  Table-9  is  a  summary  of  effect  size  of
        has  larger impact on  the  dependent  each construct, where “motivation” has
        variable.                               the largest effect size and “personality”

          Indian Journal of Educational Technology                               35
          Volume 3, Issue 2, July 2021