
Page 46 - IJET_July2021_final
P. 46
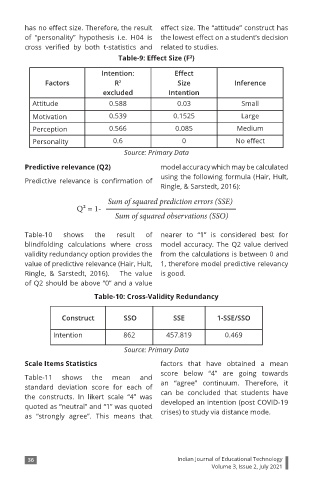
has no effect size. Therefore, the result  effect size. The “attitude” construct has
        of  “personality”  hypothesis  i.e.  H04  is  the lowest effect on a student’s decision
        cross  verified  by  both  t-statistics  and  related to studies.
                                   Table-9: Effect Size (F )
                                                        2
                              Intention:            Effect
              Factors             R 2               Size             Inference
                               excluded           Intention
          Attitude               0.588              0.03               Small
          Motivation             0.539             0.1525              Large
          Perception             0.566              0.085             Medium

          Personality             0.6                 0              No effect
                                     Source: Primary Data
        Predictive relevance (Q2)               model accuracy which may be calculated
                                                using the following formula (Hair, Hult,
        Predictive  relevance  is  confirmation  of
                                                Ringle, & Sarstedt, 2016):
                                Sum of squared prediction errors (SSE)
                       Q2 = 1-
                                  Sum of squared observations (SSO)


        Table-10   shows    the    result  of   nearer to “1” is considered best for
        blindfolding  calculations  where  cross  model accuracy.  The Q2 value derived
        validity redundancy option provides the  from the calculations is between 0 and
        value of predictive relevance (Hair, Hult,  1, therefore model predictive relevancy
        Ringle,  &  Sarstedt,  2016).      The  value  is good.
        of Q2 should be above “0” and a value

                            Table-10: Cross-Validity Redundancy


                   Construct         SSO           SSE          1-SSE/SSO

                Intention            862         457.819          0.469
                                     Source: Primary Data

        Scale Items Statistics                  factors that  have  obtained  a  mean
                                                score below  “4” are going  towards
        Table-11   shows    the  mean     and
        standard  deviation  score for  each  of   an “agree” continuum.  Therefore, it
        the constructs. In  likert scale “4” was   can be concluded  that students  have
        quoted as “neutral” and “1” was quoted   developed an intention (post COVID-19
        as  “strongly  agree”. This  means  that   crises) to study via distance mode.


         36                                         Indian Journal of Educational Technology
                                                              Volume 3, Issue 2, July 2021