
Page 44 - IJET_July2021_final
P. 44
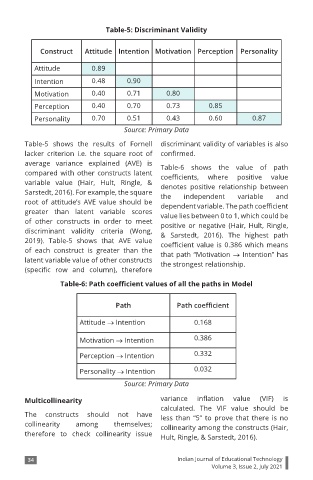
Table-5: Discriminant Validity


             Construct    Attitude Intention Motivation Perception Personality


           Attitude         0.89
           Intention        0.48      0.90
           Motivation       0.40      0.71       0.80
           Perception       0.40      0.70       0.73        0.85

           Personality      0.70      0.51       0.43        0.60         0.87
                                     Source: Primary Data
        Table-5 shows the results of Fornell  discriminant validity of variables is also
        lacker criterion i.e. the square root of  confirmed.
        average variance explained (AVE) is     Table-6  shows  the  value  of  path
        compared with other constructs latent   coefficients,   where   positive   value
        variable  value  (Hair,  Hult,  Ringle,  &   denotes  positive  relationship  between
        Sarstedt, 2016). For example, the square   the  independent   variable   and
        root of attitude’s AVE value should  be   dependent variable. The path coefficient
        greater than latent  variable  scores   value lies between 0 to 1, which could be
        of other constructs in order to meet    positive  or negative  (Hair, Hult,  Ringle,
        discriminant  validity  criteria (Wong,   &  Sarstedt,  2016).  The  highest  path
        2019).  Table-5  shows  that AVE value   coefficient value is 0.386 which means
        of each construct is greater than the   that path “Motivation → Intention” has
        latent variable value of other constructs   the strongest relationship.
        (specific  row  and  column),  therefore
                  Table-6: Path coefficient values of all the paths in Model


                                   Path             Path coefficient

                        Attitude → Intention             0.168


                        Motivation → Intention           0.386

                        Perception → Intention           0.332
                        Personality → Intention          0.032
                                     Source: Primary Data


        Multicollinearity                       variance   inflation   value   (VIF)   is
                                                calculated. The VIF value should  be
        The constructs should  not have         less than “5” to prove that there is no
        collinearity   among      themselves;   collinearity among the constructs (Hair,
        therefore  to  check  collinearity  issue   Hult, Ringle, & Sarstedt, 2016).


         34                                         Indian Journal of Educational Technology
                                                              Volume 3, Issue 2, July 2021