
Page 59 - IJET_July2021_final
P. 59
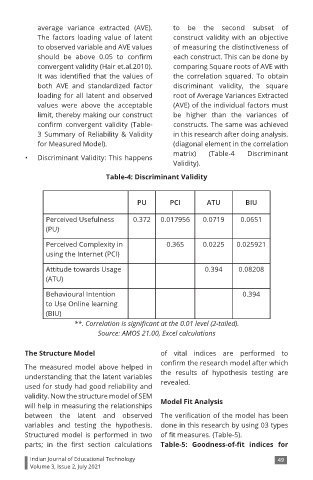
average variance extracted (AVE).      to be the second  subset of
            The factors loading  value of latent   construct validity  with  an objective
            to observed variable and AVE values    of measuring the distinctiveness of
            should  be  above  0.05  to  confirm   each construct. This can be done by
            convergent validity (Hair et.al.2010).   comparing Square roots of AVE with
            It  was  identified  that  the  values  of   the  correlation squared.  To obtain
            both  AVE  and  standardized  factor   discriminant  validity,  the  square
            loading for all latent and observed    root of Average Variances Extracted
            values were above the acceptable       (AVE) of the individual factors must
            limit, thereby making our construct    be higher  than  the variances of
            confirm  convergent  validity  (Table-   constructs. The same was achieved
            3  Summary  of  Reliability  &  Validity   in this research after doing analysis.
            for Measured Model).                   (diagonal element in the correlation
                                                   matrix)    (Table-4   Discriminant
        •   Discriminant Validity: This happens
                                                   Validity).
                                Table-4: Discriminant Validity


                                         PU       PCI        ATU        BIU

              Perceived Usefulness      0.372   0.017956    0.0719     0.0651
              (PU)
              Perceived Complexity in            0.365      0.0225    0.025921
              using the Internet (PCI)

              Attitude towards Usage                        0.394     0.08208
              (ATU)
              Behavioural Intention                                    0.394
              to Use Online learning
              (BIU)
                       **. Correlation is significant at the 0.01 level (2-tailed).
                             Source: AMOS 21.00, Excel calculations

        The Structure Model                     of  vital  indices  are performed  to

                                                confirm the research model after which
        The  measured model  above  helped  in
        understanding that the latent variables   the results of hypothesis  testing are
        used for study had good reliability and   revealed.
        validity. Now the structure model of SEM   Model Fit Analysis
        will help in measuring the relationships
        between  the latent  and observed  The verification of the model has been
        variables and testing  the  hypothesis.  done in this research by using 03 types
        Structured  model is performed in  two  of fit measures. (Table-5).
        parts;  in  the  first  section  calculations  Table-5:  Goodness-of-fit  indices  for
          Indian Journal of Educational Technology                               49
          Volume 3, Issue 2, July 2021