
Page 283 - IJET_July2021_final
P. 283
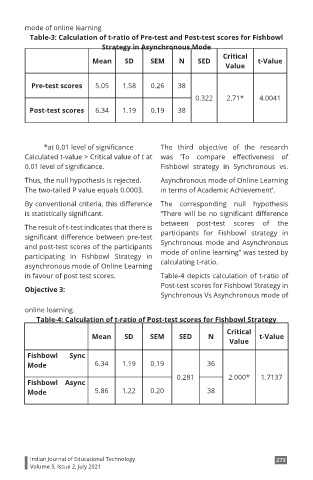
mode of online learning
          Table-3: Calculation of t-ratio of Pre-test and Post-test scores for Fishbowl
                               Strategy in Asynchronous Mode
                                                                  Critical
                            Mean     SD      SEM     N    SED               t-Value
                                                                  Value


          Pre-test scores    5.05   1.58     0.26    38
                                                          0.322    2.71*    4.0041
          Post-test scores   6.34   1.19     0.19    38


              *at 0.01 level of significance    The  third  objective  of  the  research
        Calculated t-value > Critical value of t at  was  ‘To  compare  effectiveness  of
        0.01 level of significance.             Fishbowl  strategy  in  Synchronous  vs.

        Thus, the null hypothesis is rejected.  Asynchronous mode of Online Learning
        The two-tailed P value equals 0.0003.   in terms of Academic Achievement’.
        By conventional criteria, this difference  The  corresponding  null  hypothesis
        is statistically significant.           “There will be no significant difference
                                                between  post-test  scores  of  the
        The result of t-test indicates that there is
        significant  difference  between  pre-test   participants for Fishbowl  strategy in
        and post-test scores of the participants   Synchronous  mode and  Asynchronous
        participating in Fishbowl  Strategy in   mode of online learning” was tested by
        asynchronous mode of Online Learning    calculating t-ratio.
        in favour of post test scores.          Table-4 depicts calculation of t-ratio of
                                                Post-test scores for Fishbowl Strategy in
        Objective 3:
                                                Synchronous Vs Asynchronous mode of
        online learning.
            Table-4: Calculation of t-ratio of Post-test scores for Fishbowl Strategy
                                                                   Critical
                            Mean     SD      SEM     SED     N              t-Value
                                                                   Value
         Fishbowl    Sync
         Mode               6.34    1.19     0.19            36
                                                    0.281          2.000*    1.7137
         Fishbowl Async
         Mode               5.86    1.22     0.20            38


          Indian Journal of Educational Technology                               273
          Volume 3, Issue 2, July 2021