
Page 224 - IJET_July2021_final
P. 224
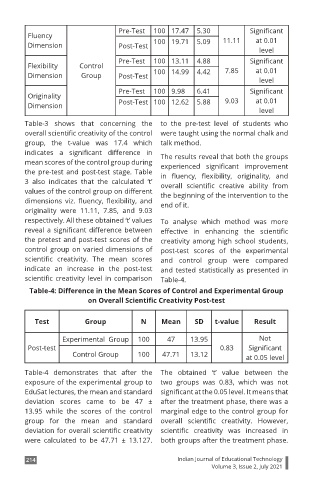
Pre-Test   100 17.47   5.30           Significant
         Fluency                                                  11.11    at 0.01
         Dimension                 Post-Test  100 19.71   5.09
                                                                            level
                                   Pre-Test   100 13.11   4.88           Significant
         Flexibility    Control                                   7.85     at 0.01
         Dimension       Group     Post-Test  100 14.99   4.42
                                                                            level
                                   Pre-Test   100 9.98    6.41           Significant
         Originality                                              9.03     at 0.01
         Dimension                 Post-Test 100 12.62    5.88
                                                                            level

        Table-3  shows that concerning  the  to the pre-test level of students who
        overall scientific creativity of the control  were taught using the normal chalk and
        group, the t-value was 17.4 which  talk method.
        indicates  a  significant  difference  in   The results reveal that both the groups
        mean scores of the control group during   experienced  significant  improvement
        the  pre-test and  post-test  stage. Table   in  fluency,  flexibility,  originality,  and
        3  also indicates that the  calculated ‘t’   overall  scientific  creative  ability  from
        values of the control group on different   the beginning of the intervention to the
        dimensions  viz.  fluency,  flexibility,  and   end of it.
        originality  were  11.11,  7.85,  and  9.03
        respectively. All these obtained ‘t’ values   To analyse which  method was more
        reveal a significant difference between   effective  in  enhancing  the  scientific
        the pretest and post-test scores of the   creativity among high  school students,
        control group on varied dimensions of   post-test scores of the experimental
        scientific  creativity.  The  mean  scores   and  control group  were compared
        indicate an increase in the post-test   and tested statistically as presented in
        scientific  creativity  level  in  comparison   Table-4.
          Table-4: Difference in the Mean Scores of Control and Experimental Group
                          on Overall Scientific Creativity Post-test


           Test           Group           N     Mean     SD    t-value     Result

                   Experimental  Group   100     47     13.95               Not
         Post-test                                               0.83    Significant
                      Control Group      100    47.71   13.12           at 0.05 level

        Table-4  demonstrates that after the  The  obtained  ‘t’  value  between  the
        exposure of the experimental group to  two groups was 0.83, which was not
        EduSat lectures, the mean and standard  significant at the 0.05 level. It means that
        deviation  scores came to  be  47  ±  after the treatment phase, there was a
        13.95  while  the  scores of  the  control  marginal edge to the control group for
        group  for the  mean and  standard  overall  scientific  creativity.  However,
        deviation for overall scientific creativity  scientific  creativity  was  increased  in
        were calculated  to be  47.71  ±  13.127.  both groups after the treatment phase.

         214                                        Indian Journal of Educational Technology
                                                              Volume 3, Issue 2, July 2021