
Page 222 - IJET_July2021_final
P. 222
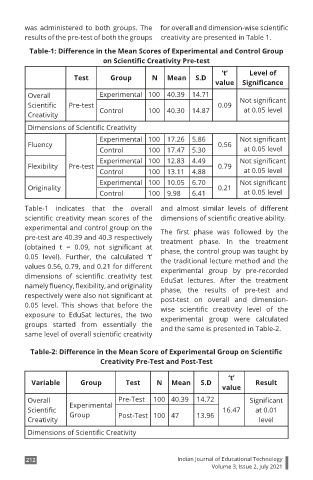
was administered to both groups. The  for overall and dimension-wise scientific
        results of the pre-test of both the groups  creativity are presented in Table 1.
          Table-1: Difference in the Mean Scores of Experimental and Control Group
                               on Scientific Creativity Pre-test
                                                                 ‘t’     Level of
                       Test      Group       N   Mean     S.D
                                                               value   Significance
         Overall              Experimental 100   40.39   14.71        Not significant
         Scientific   Pre-test                                  0.09    at 0.05 level
         Creativity           Control       100  40.30   14.87
         Dimensions of Scientific Creativity
                              Experimental 100   17.26   5.86         Not significant
         Fluency                                                0.56
                              Control       100  17.47   5.30           at 0.05 level
                              Experimental 100   12.83   4.49         Not significant
         Flexibility  Pre-test                                  0.79
                              Control       100  13.11   4.88           at 0.05 level
                              Experimental 100   10.05   6.70         Not significant
         Originality                                            0.21
                              Control       100  9.98    6.41           at 0.05 level

        Table-1 indicates that the overall  and  almost  similar  levels  of  different
        scientific  creativity  mean  scores  of  the  dimensions of scientific creative ability.
        experimental and control group on the   The  first  phase  was  followed  by  the
        pre-test are 40.39 and 40.3 respectively   treatment phase. In  the treatment
        (obtained  t  =  0.09,  not  significant  at   phase, the control group was taught by
        0.05  level). Further, the calculated ‘t’   the traditional lecture method and the
        values 0.56, 0.79, and 0.21 for different   experimental  group  by  pre-recorded
        dimensions  of  scientific  creativity  test   EduSat lectures. After the treatment
        namely fluency, flexibility, and originality   phase,  the  results  of  pre-test  and
        respectively were also not significant at   post-test on overall and  dimension-
        0.05  level. This shows  that before the   wise  scientific  creativity  level  of  the
        exposure  to  EduSat  lectures,  the  two   experimental group were calculated
        groups  started  from essentially  the   and the same is presented in Table-2.
        same level of overall scientific creativity

          Table-2: Difference in the Mean Score of Experimental Group on Scientific
                              Creativity Pre-Test and Post-Test

                                                                   ‘t’
          Variable      Group        Test     N    Mean    S.D             Result
                                                                 value

         Overall     Experimental   Pre-Test  100 40.39   14.72          Significant
         Scientific   Group                                       16.47    at 0.01
         Creativity                Post-Test  100 47      13.96             level
         Dimensions of Scientific Creativity


         212                                        Indian Journal of Educational Technology
                                                              Volume 3, Issue 2, July 2021