
Page 245 - IJET_July2021_final
P. 245
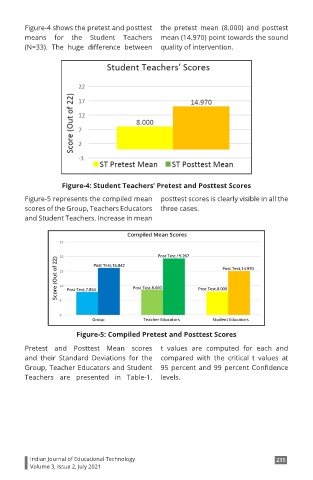
Figure-4 shows the pretest and posttest  the  pretest mean (8.000)  and  posttest
        means  for  the  Student  Teachers  mean (14.970) point towards the sound
        (N=33).  The  huge  difference  between  quality of intervention.


                   Figure-4: Student Teachers’ Pretest and Posttest Scores
        Figure-5 represents the compiled mean  posttest scores is clearly visible in all the
        scores of the Group, Teachers Educators  three cases.
        and Student Teachers. Increase in mean


                       Figure-5: Compiled Pretest and Posttest Scores
        Pretest and  Posttest Mean  scores  t values are computed  for each and
        and  their Standard  Deviations for the  compared with  the  critical t values at
        Group, Teacher Educators and Student  95 percent and 99 percent Confidence
        Teachers are  presented  in  Table-1.  levels.


          Indian Journal of Educational Technology                               235
          Volume 3, Issue 2, July 2021