
Page 244 - IJET_July2021_final
P. 244
Data Analysis as posttest (15 Teacher Educators and
33 Student Teachers). The same has
Pretest in the form of Google form was
shared with the selected participants been presented in Table 1 in the coming
(17 Teacher Educators and 52 Student pages.
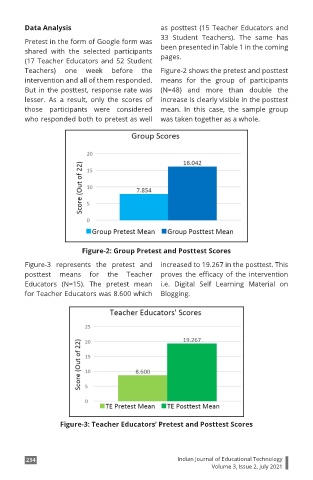
Teachers) one week before the Figure-2 shows the pretest and posttest
intervention and all of them responded. means for the group of participants
But in the posttest, response rate was (N=48) and more than double the
lesser. As a result, only the scores of increase is clearly visible in the posttest
those participants were considered mean. In this case, the sample group
who responded both to pretest as well was taken together as a whole.
Figure-2: Group Pretest and Posttest Scores
Figure-3 represents the pretest and increased to 19.267 in the posttest. This
posttest means for the Teacher proves the efficacy of the intervention
Educators (N=15). The pretest mean i.e. Digital Self Learning Material on
for Teacher Educators was 8.600 which Blogging.
Figure-3: Teacher Educators’ Pretest and Posttest Scores
234 Indian Journal of Educational Technology
Volume 3, Issue 2, July 2021