
Page 233 - IJET_July2021_final
P. 233
Results and Discussions were gathered. Overall, 156 respondents
submitted the questionnaires within 10
Responses from 156 respondents,
belonging to different states of India days.
Demographic data
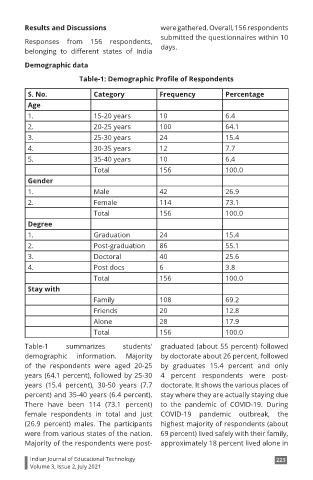
Table-1: Demographic Profile of Respondents
S. No. Category Frequency Percentage
Age
1. 15-20 years 10 6.4
2. 20-25 years 100 64.1
3. 25-30 years 24 15.4
4. 30-35 years 12 7.7
5. 35-40 years 10 6.4
Total 156 100.0
Gender
1. Male 42 26.9
2. Female 114 73.1
Total 156 100.0
Degree
1. Graduation 24 15.4
2. Post-graduation 86 55.1
3. Doctoral 40 25.6
4. Post docs 6 3.8
Total 156 100.0
Stay with
Family 108 69.2
Friends 20 12.8
Alone 28 17.9
Total 156 100.0
Table-1 summarizes students' graduated (about 55 percent) followed
demographic information. Majority by doctorate about 26 percent, followed
of the respondents were aged 20-25 by graduates 15.4 percent and only
years (64.1 percent), followed by 25-30 4 percent respondents were post-
years (15.4 percent), 30-50 years (7.7 doctorate. It shows the various places of
percent) and 35-40 years (6.4 percent). stay where they are actually staying due
There have been 114 (73.1 percent) to the pandemic of COVID-19. During
female respondents in total and just COVID-19 pandemic outbreak, the
(26.9 percent) males. The participants highest majority of respondents (about
were from various states of the nation. 69 percent) lived safely with their family,
Majority of the respondents were post- approximately 18 percent lived alone in
Indian Journal of Educational Technology 223
Volume 3, Issue 2, July 2021