
Page 162 - IJET_July2021_final
P. 162
Distribution of survey and sample size of responses were elicited from
The survey was conducted through government-funded organizations over
Google Forms and the link was private universities. Accordingly, for
shared with the students of private the parameters examining effective
as well as government educational online learning, data were analyzed for
institutions, majorly located in Delhi each of these subgroups independently
and National Capital Region (NCR). An to detect any significant differences
attempt was made to target students or associations between these
pursuing diverse streams for instance dimensions. Microsoft Office Excel
humanities, sciences, engineering, (2007) spreadsheet software has been
education, etc. The target population used in organizing and plotting all data.
consisted of undergraduates as well
as postgraduates and a total of 249 Analysis & Results
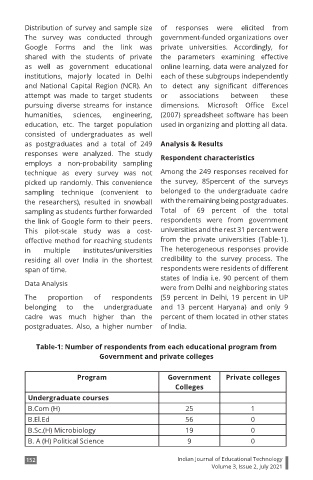
responses were analyzed. The study Respondent characteristics
employs a non-probability sampling
technique as every survey was not Among the 249 responses received for
picked up randomly. This convenience the survey, 85percent of the surveys
sampling technique (convenient to belonged to the undergraduate cadre
the researchers), resulted in snowball with the remaining being postgraduates.
sampling as students further forwarded Total of 69 percent of the total
the link of Google form to their peers. respondents were from government
This pilot-scale study was a cost- universities and the rest 31 percent were
effective method for reaching students from the private universities (Table-1).
in multiple institutes/universities The heterogeneous responses provide
residing all over India in the shortest credibility to the survey process. The
span of time. respondents were residents of different
states of India i.e. 90 percent of them
Data Analysis
were from Delhi and neighboring states
The proportion of respondents (59 percent in Delhi, 19 percent in UP
belonging to the undergraduate and 13 percent Haryana) and only 9
cadre was much higher than the percent of them located in other states
postgraduates. Also, a higher number of India.
Table-1: Number of respondents from each educational program from
Government and private colleges
Program Government Private colleges
Colleges
Undergraduate courses
B.Com (H) 25 1
B.El.Ed 56 0
B.Sc.(H) Microbiology 19 0
B. A (H) Political Science 9 0
152 Indian Journal of Educational Technology
Volume 3, Issue 2, July 2021